My idea for this post came when I was creating examples for a colleague on how changing the design and functionality of a report page can make it load faster. There are many factors when it comes performance improvements, adding the functionality of swapping visuals can improve performance similar to how a drill through page does it.
Some view working with bookmarks as a cumbersome task. Very understandable, if your bookmark and selection pane looks something like this.
Which even isn’t as bad as it can get. You’ve probably managed to create bookmarks and setup the desired functionality under similar circumstances. But, you dreaded the day a changes request rolled in and that report page had to be updated. So, perhaps you have, like myself and many others, avoided working with bookmarks. But you don’t have to.
Adam and Patrick (Guy in a Cube) has a whole series of videos on the topic, buttons, selections and bookmarks where they cover mastering bookmarks and how to make navigation easier. The only difference from Adam’s video on swapping visuals, is that I now can use the bookmark navigator instead a creating separate buttons for launching each bookmark.
Setup – Grouping and Naming
I’ve created a simple report page using the Adventure Works DW2020 dataset. I want the ability to swap between the ribbon chart showing Sales Units per Category over months and a matrix with the full product hierarchy and Sales Units over months.
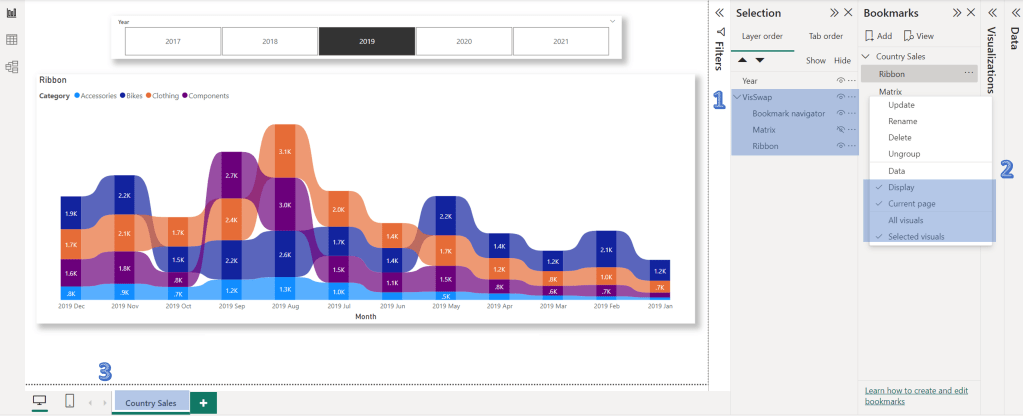
- The visuals I want to swap are grouped and named ‘VizSwap’. The layering order is not relevant in this case particular case.
- A bookmark to show each visual and hide the other. Both of them are set to ‘Display’, ‘Current Page’ and ‘Selected Visuals’
- The bookmarks are grouped and the group was renamed to match the report page.
Now, because the visuals I want my bookmarks to affect are grouped, I can easily update them by selecting the ‘VisSwap’ group in the selection pane. Here, I first hide the matrix, I then right click on the ‘Ribbon’ bookmark and click ‘Update’. Now the ‘Ribbon’ bookmark is configured.

The ‘VisSwap’ group should still be selected in the selection pane, so I hide the ‘Ribbon’ and unhide the ‘Matrix’ here. I make sure the ‘VisSwap’ group is selected before I update the ‘Matrix’ bookmark in the bookmarks pane. Similar to how i updated the ‘Ribbon’ bookmark. Grouping the visuals made it really easy for me to update my bookmarks. Clicking each bookmark, the visuals should now swap on the canvas.
Lets bring in the bookmark navigator. It’s located under buttons, in the inserts pane of the ribbon. Now, if I had a swath of bookmarks, similar to what was depicted in the beginning of this post, all of them would be shown in the bookmark navigator, which wouldn’t be useful. But since I’ve grouped my bookmarks, I can select the group ‘Category Sales’ which contains he bookmarks i want to use in this navigator, by going to the Bookmarks section in the Format pane for the bookmark navigator visual.
And now, I can swap my visuals with the bookmark navigator.
Now you know how grouping visual and bookmarks can make working with bookmarks easier for you. I would very much like to hear any workarounds you have when working with bookmarks. Have you incorporated similar functionality in your reports or done something completely different with bookmarks?

Very precise explanations and useful, thanks
LikeLiked by 1 person