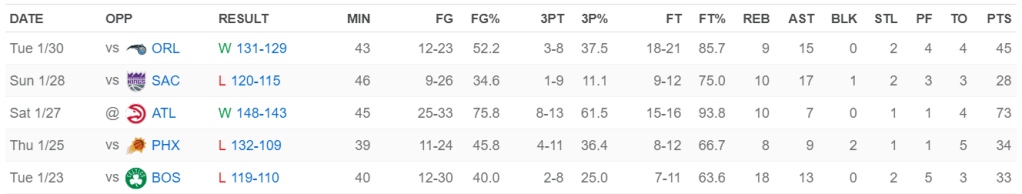
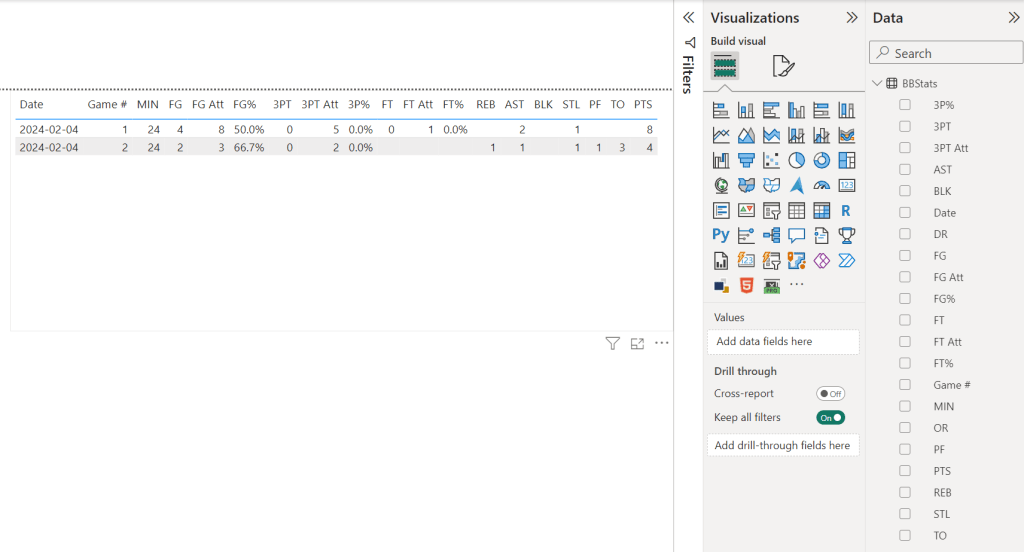
Yesterday, my son tended a 3 team basketball tournament so I though I’d track his stats for the two games on my phone and later find a way to convert that into a stat table. I was aiming for a stat sheet layout similar to this one from ESPN. Version 1.0 will be without the OPP and RESULT columns though.
At the time, all my imagination could come up with for collecting these figures, was the note app on my iPhone. It was easy enough to fill in that I could follow as the game progressed.
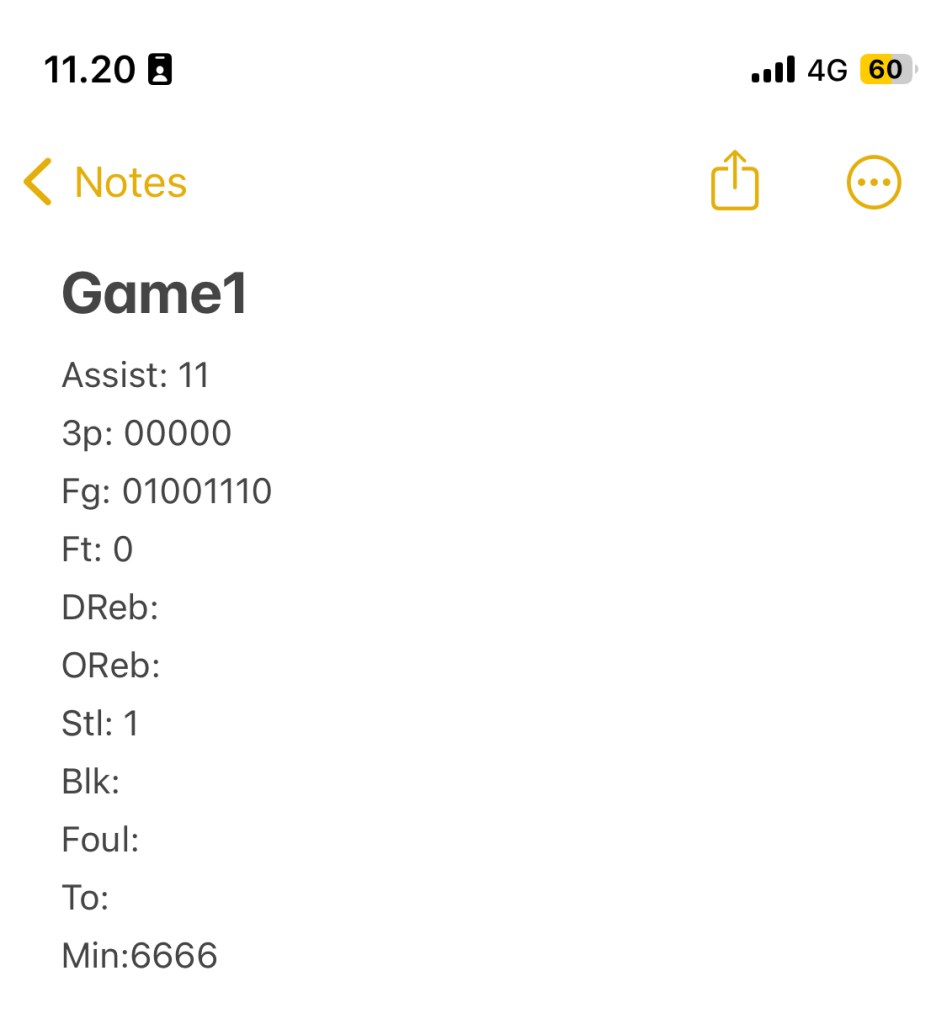
In the first game he totaled: 2 assists, 0/5 from three, 4/8 within the arc, 0/1 from the free-throw line , 0 rebounds, 1 steal, 0 blocks, fouls and turnovers in 24 minutes playing time. In his own words – not his best game to date – but they ended up winning both games. 😊
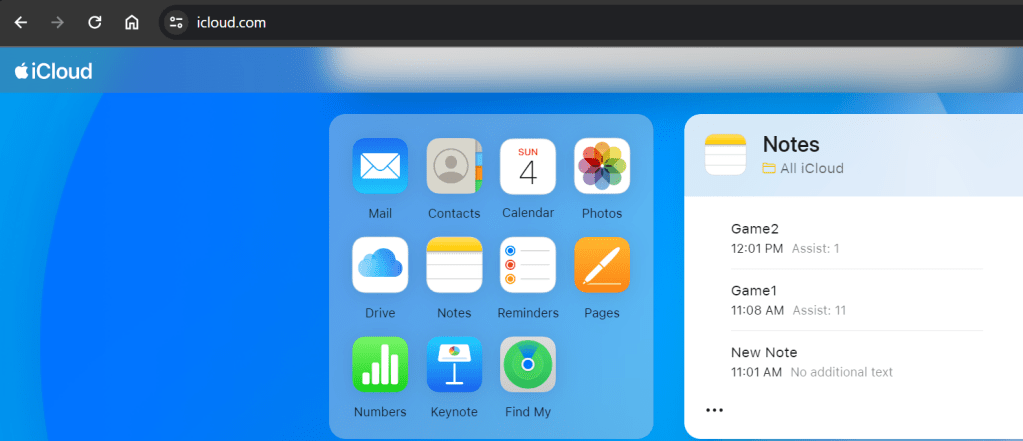
I used the same template for the 2nd game, and my intention was to import the data into Power BI from text. I visited icloud.com in my browser, where i can see my notes.
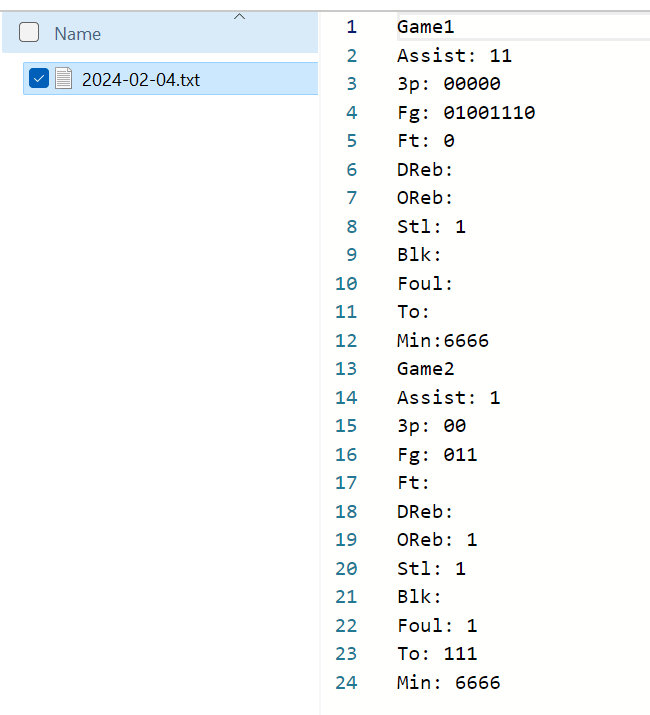
From here I copy the content of the notes ‘Game1’ and ‘Game2’ into notepad in order to save it as text. To my knowledge, there is no “citizen developer method” for connecting to data stored anywhere in Apple’s iCloud. I named the file with todays date. The file looks like this.
In Power BI I used the ‘From folder’ connector which, if I get this right, will enable me to add new stat sheets based on the same note template, to the folder and just refresh the model.
Power Query Transformations
Connecting to a folder, you get a list of the files in that folder and any subfolders. For this query we only want to work with .txt files so first step is a filter ensuring that.
"Filtered Rows" = Table.SelectRows(Source, each [Extension] = ".txt"), Fist file contains lines of text related to two separate games. Second query step is to split this text file into a list of games, and then each game into a list of stats.
#"Added Custom" = Table.AddColumn(#"Filtered Rows", "Stats", each
    let
        BinaryToText = Text.FromBinary([Content]),
        /*Split Text into list of game texts*/
        SplitGames = List.Skip(Text.Split(BinaryToText,"Game"),1),
        /*for each game split text into list of stats*/
        SplitStats = List.Transform(SplitGames, each Text.Split(_,"#(lf)"))
    in
        SplitStats
),
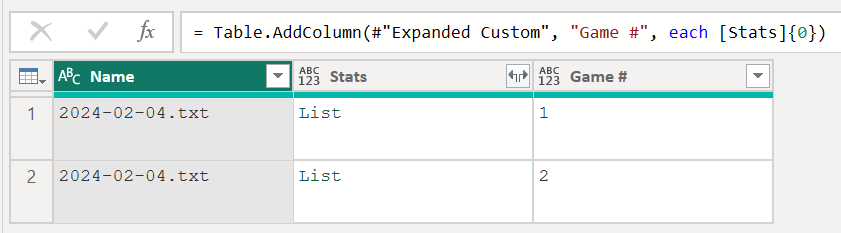
Remove other columns and expand the list of games(Stats column). Now I add the “Game #”, which is the first value in each list of stats.
Next in order is expanding the Stats column yet again to get a row for each stat per game. Filter the table to only those rows containing “:” in the Stats column and splitting by the “:” delimiter.
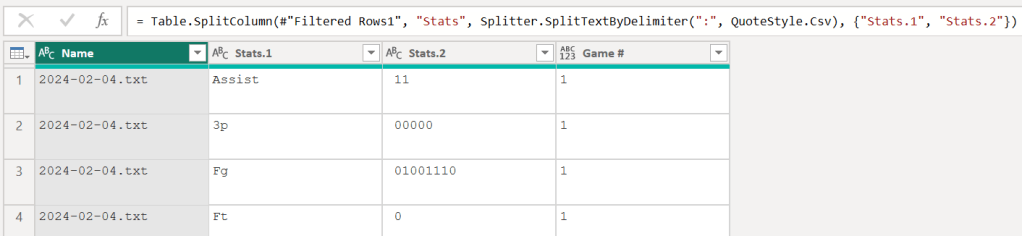
The “Stats.2” column is subsequently cleaned up using Text.Clean() and Text.Trim() and blanks are replaced with nulls before Stat.1 is pivoted with Stat.2 as values without any aggregation. Now we have a row for each game with a column for each collected stat.

Counting or Summing values in a text string
When collecting these stats the focus was on making the the collection easy and then turning it tabular in power query. This was done using two custom functions to create the stat columns which will be loaded to model.
fxCount – counts the number of characters in a text string, using Text.Length(), which will be used for turning the string “01001110” from the Fg column 8 field goal attempts. Simple.
( aString )=>

let

    len = Text.Length(aString)

in

    len
fxSum – using the Splitter.SplitTextByRepeatedLengths the string “01001110” is split into a list of individual characters which is converted to numbers and summed to return 4 made field goals.
( aString )=>
let
texttolist = Splitter.SplitTextByRepeatedLengths(1,true)(aString),
changetype = List.Transform(texttolist,each Number.From(_)),
sum = List.Sum(changetype)
in
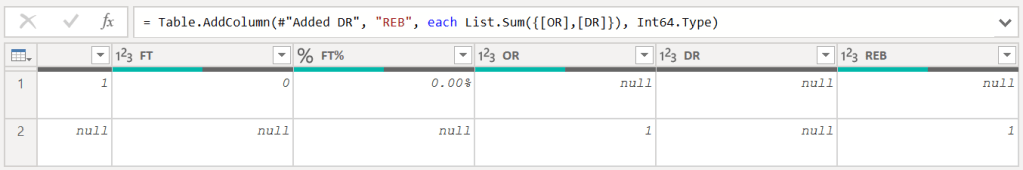
sumHandling additions with null values
I began invoking functions to end up with the columns i wanted to load to model. To handle the null values when calculating the columns PTS and REB, i used List.Sum as adding a value and null returns null.
Now I do a simple Table.SelectColumns to end up with just the columns i initially wanted and load the data to Power BI.
Next I would change the following in how I collect the stats:
a. I have to handle substitutions and thus a more granular collection of playing time.
b. The stats are saved in a place where I can connect to from Power BI.